SFMTA’s Traffic Calming Fiascos
SFMTA “SAFETY PROJECTS” ARE KILLING TOO MANY RESIDENTS
• • • • • • July 2025 • • • • • •

As the death rates increase, will the San Francisco Metropolitan Transportation Agency (SFMTA) stop building slow streets, traffic neck-down road configurations, and quick-build traffic-safe projects?
Definitions:
Vision Zero: Stopped in 2024 — an SFMTA program intended to reduce traffic deaths from 2014-2024 — to zero — failed miserably and is now causing more traffic deaths than it reduces by accelerating traffic congestion.
Quick-Builds: The Vision Zero Quick-Build Program is an SFMTA effort to implement pedestrian and bicycle safety improvements quickly on the Vision Zero High Injury Network.
Neck-Down Projects: Perhaps the least effective Slow Street of all time. It takes a two-way street and converts it into a one-way street. The cars are facing each other. Neck-down bicycle lanes remain intact. Automobile drivers do not know who has the right-of-way. Go to 9th Avenue and Kirkham and see the show.
According to the April 24, 2025, Budget and Legislative Analyst (BLA) report, an estimated 100,000 vehicular crashes occurred in San Francisco streets between 2018 and 2022, causing 193 deaths and costing $2.5 billion, according to a new report from the Board of Supervisors Budget & Legislative Analyst. The numbers, while stunning, are based on extrapolations.

The agency’s FY 2024-25 capital budget for streets … projects aimed at reducing collisions, is approximately $60 million, including some carry forward funding for projects started in prior years.”
The BLA Report affirmed, “Though many of its projects have goals of reducing congestion and collisions, the SFMTA does not separately track and report such projects and related initiatives. The agency reports that the FY 2024-25 operating budget for streets-related activities is approximately $85.8 million. Excluding $52.4 million for parking enforcement, the remaining amount is approximately 33.4 million, which includes any efforts aimed at reducing collisions. The agency’s FY 2024-25 capital budget for streets, which likely includes, but is not limited to, projects aimed at reducing collisions, is approximately $60 million, including some carry forward funding for projects started in prior years.”
According to the BLA Report, one component related to traffic crashes is claims and litigation costs, according to the City Attorney’s Office. The City paid approximately $61.4 million in settlements and judgments from claims and litigation related to traffic collisions involving city vehicles over the five years from 2020 through 2024, for an average of $12.3 million per year.
Beyond this, the City settled 1,628 claims and settled or paid judgments in 129 lawsuits for 1,757 incidents. Additional costs for settlements and judgments stemming from collisions caused by this street design and infrastructure were $243,500 for 2020 through 2023.
The major causes of traffic-related deaths, based on the most cited SFMTA analysis:
• Speeding
• Failure to yield to pedestrians.
• Running Red Lights
• Stop Sign Violations
• Other contributing factors: cell phone usage, distracted driving, impaired driving, reckless driving, jaywalking, (which is now legal).
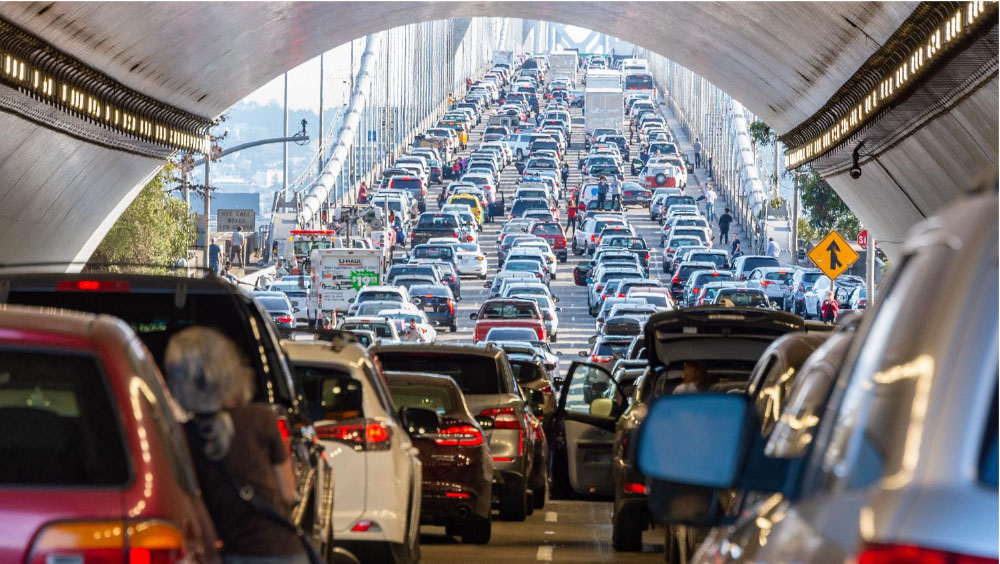
Traffic Congestion, the underlying cause of many of these traffic accidents, is seldom mentioned.
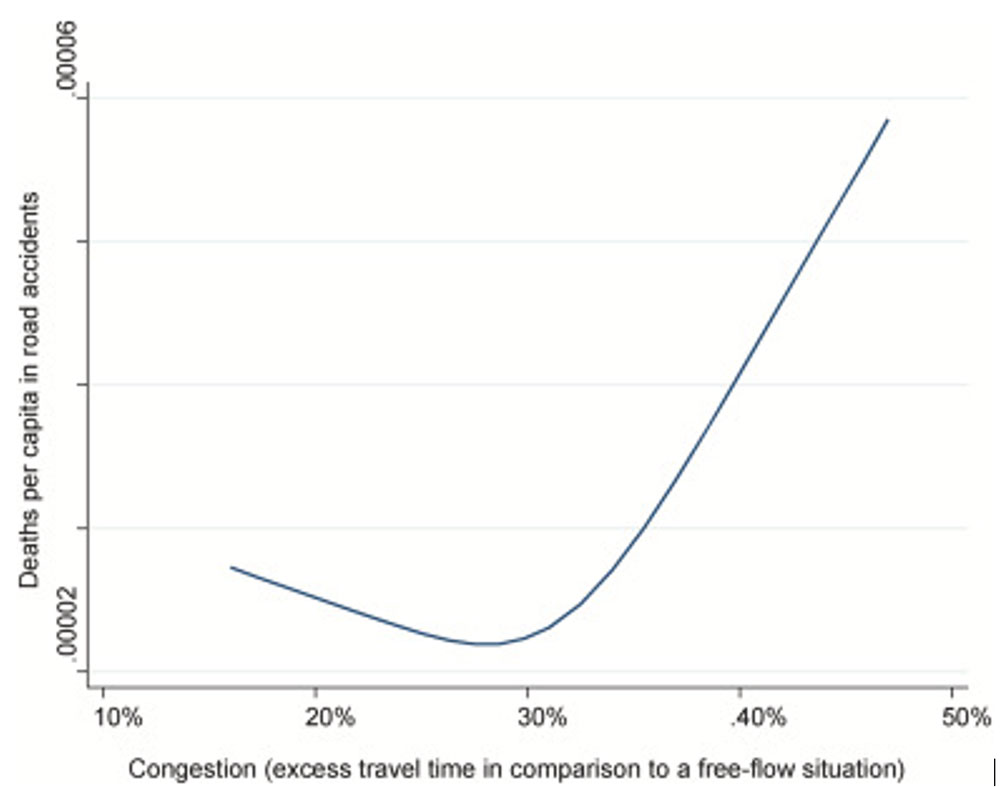
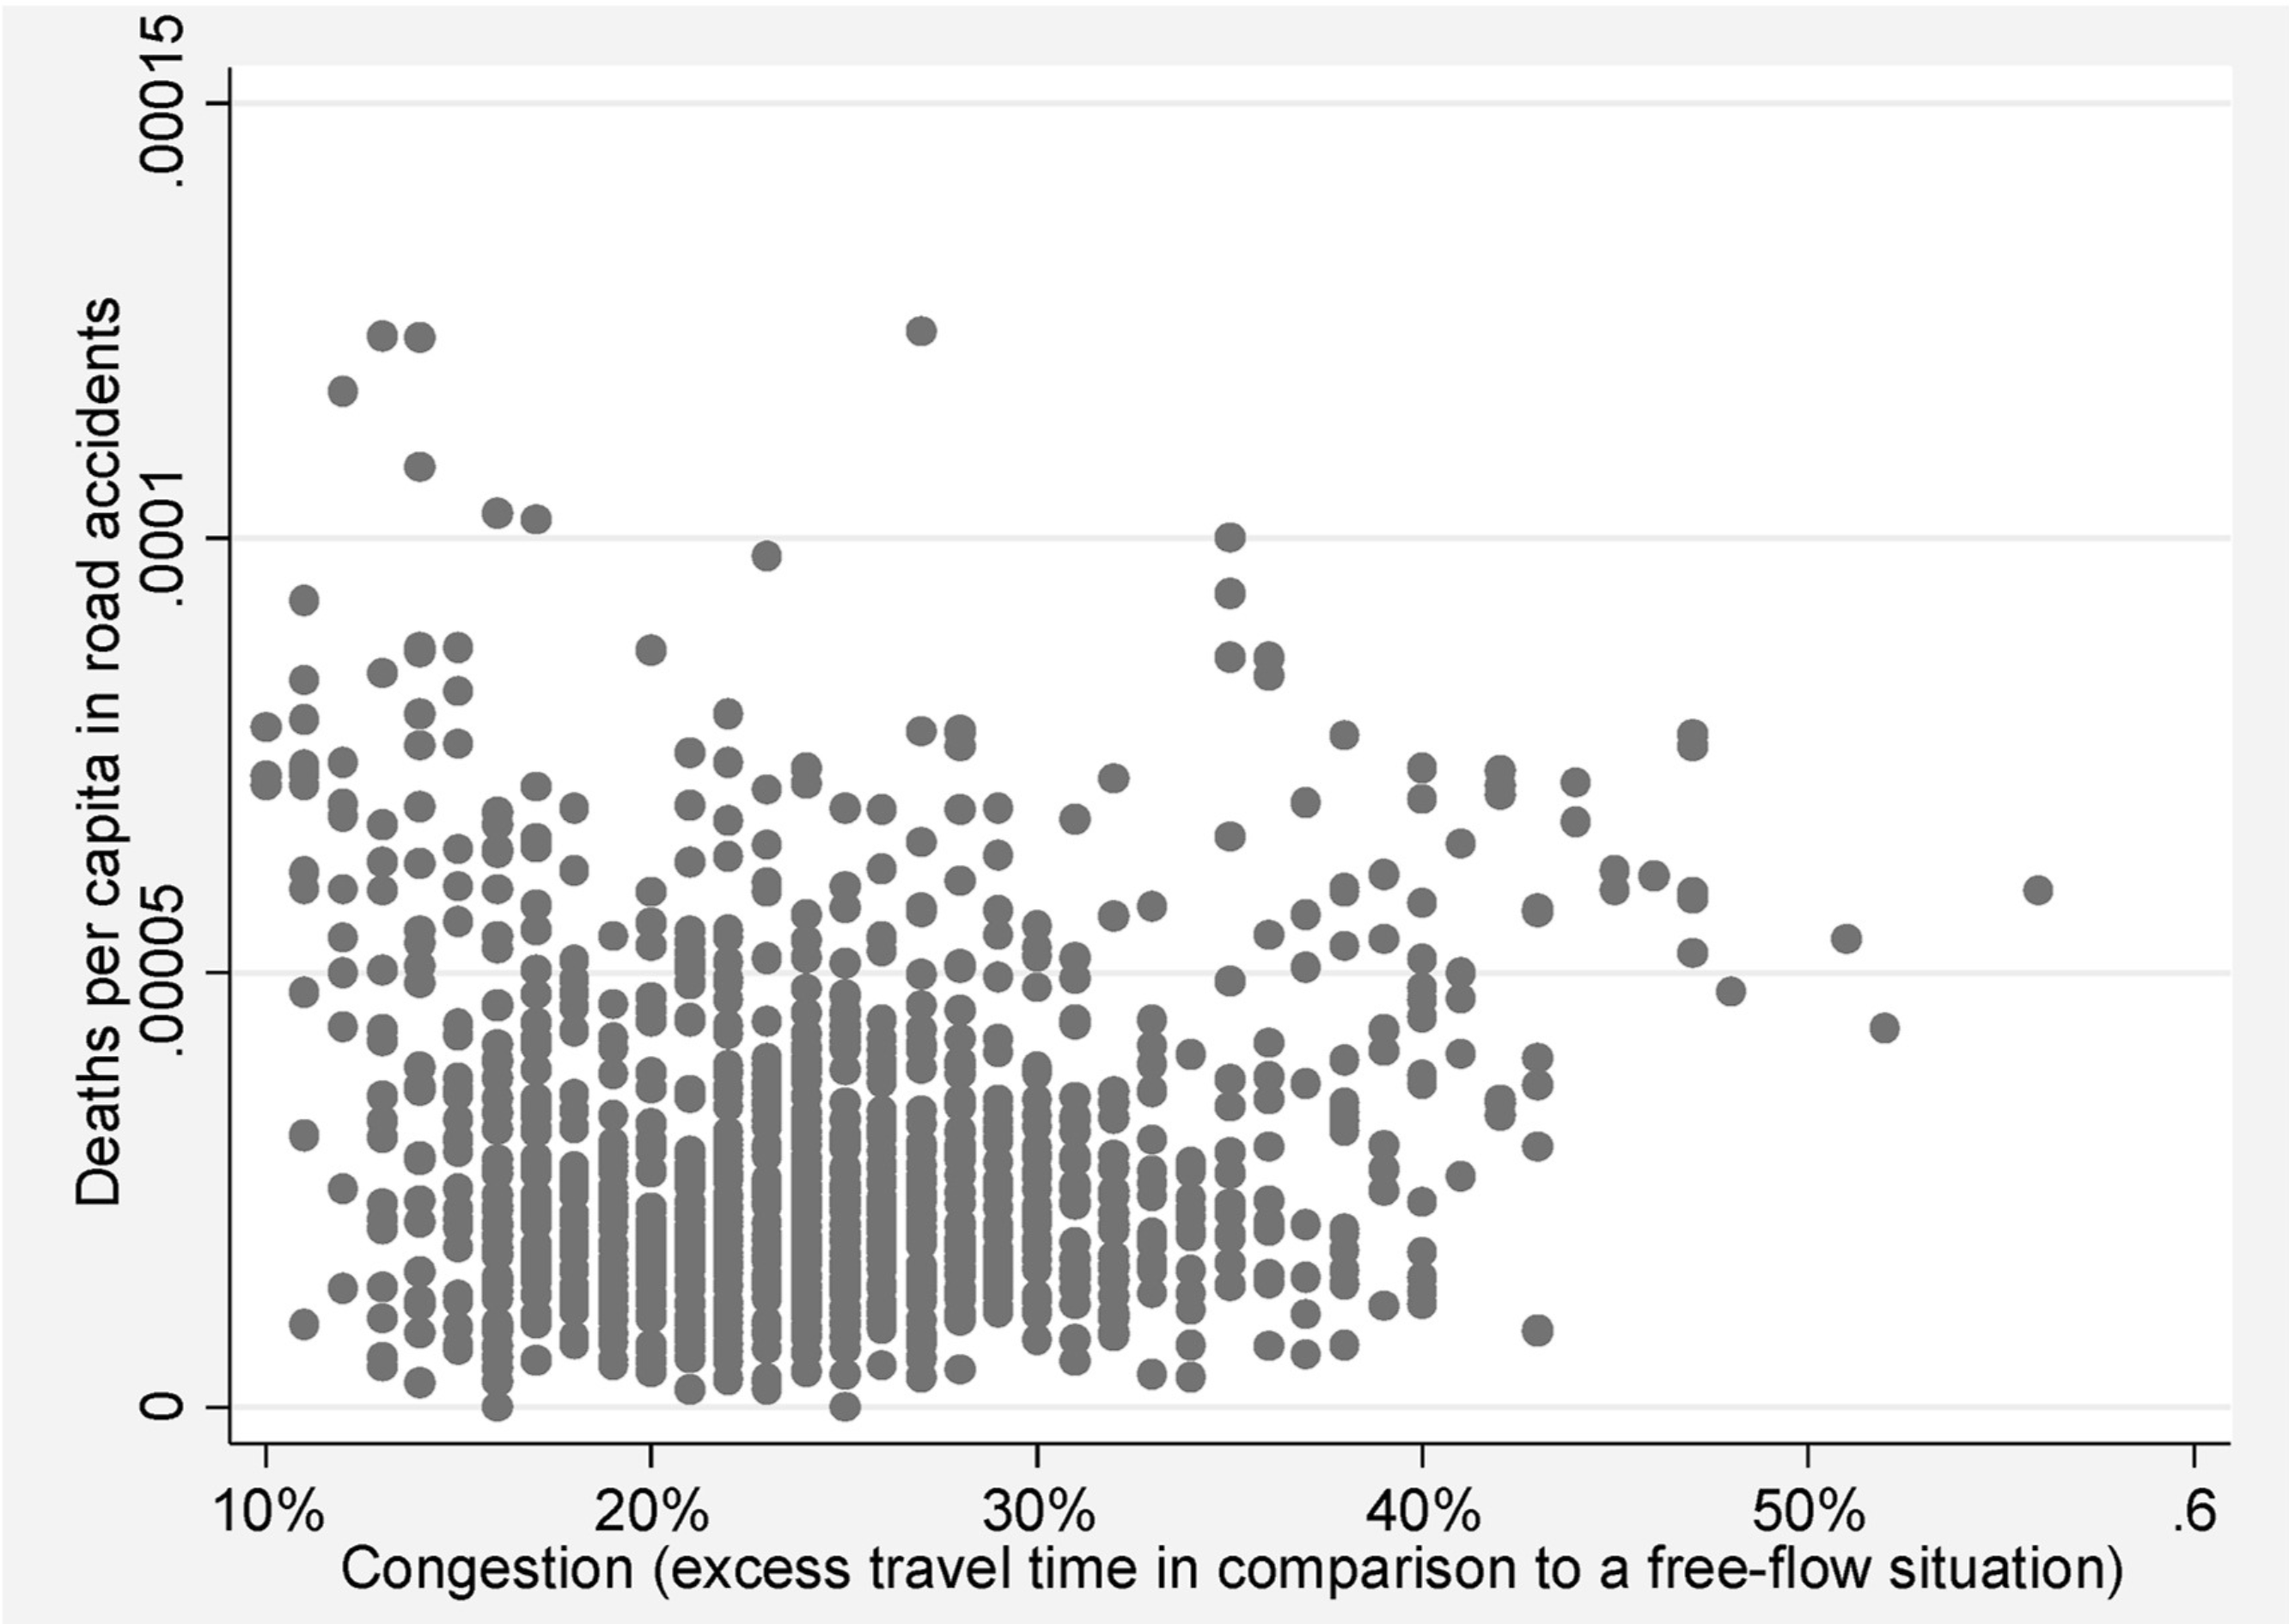
Is traffic congestion the real cause of accident victim deaths in San Francisco? One study, “On The Relationship Between Congestion and Road Safety in Cities” (ORBC&RSIC) of 129 large cities in Europe showed the following results:
“There is strong evidence of a quadratic relationship between congestion and deaths in accidents, using both parametric and non-parametric econometric techniques. The threshold point at which the relationship between congestion and fatalities in accidents is reversed — becomes positive — when congestion results in about a 30% increase in travel time compared to a free-flow situation. For most congested cities, any effective measure to contain congestion may also lead to better safety outcomes.
Put simply, when San Franciscos congestion level rises above 30%, more people will become involved/die in traffic accidents. When San Franciscos congestion level remains below 30%, fewer accidents will occur.
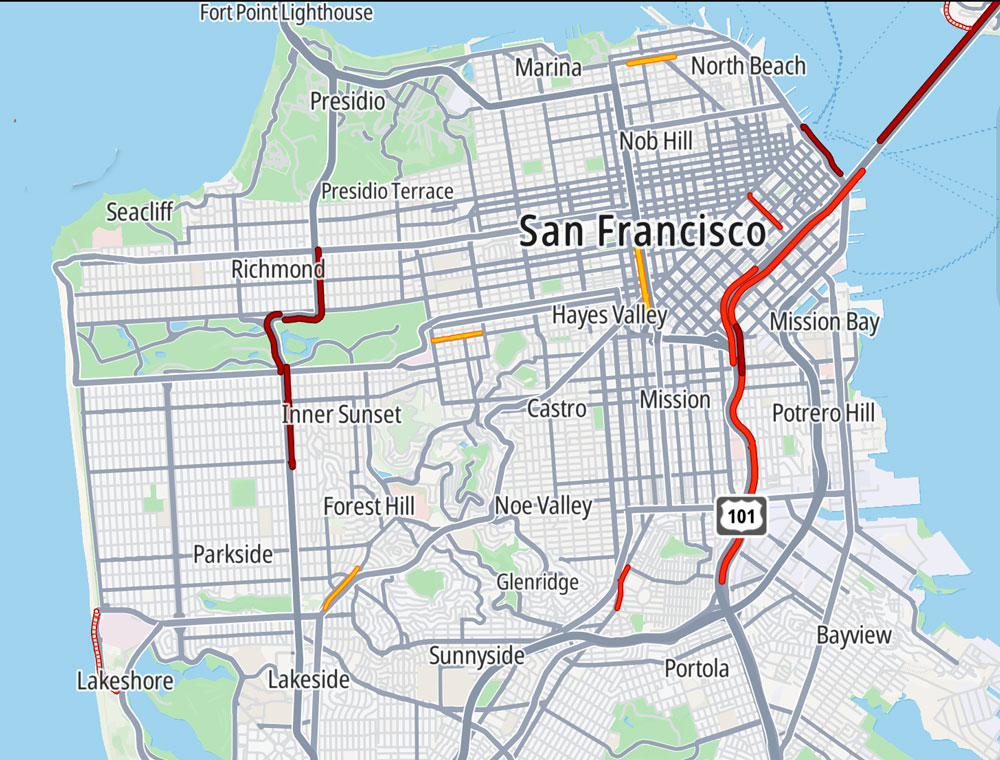
The San Francisco Examiner reported on January 30, 2025, “The Citys vehicle congestion level of 32% — meaning it took drivers an average of 32% longer to drive a mile than if there were free-flowing traffic — was the fifth-highest of any city in the country. That represented a 6% increase from last year.”
As the vehicle congestion level continues to rise, there will be more traffic accidents. In fact, San Franciscos 6% increase in congestion is less than the 10% congestion increase in the 92 largest U.S. cities.
Fatalities were higher in 2024 than in any other Vision Zero year. In total, fatalities in 2024 were almost 50 percent higher than the average over the decade. As traffic patterns adjust to the post-pandemic world, it is unclear if the high fatality rates of 2024 are an outlier or a warning of what is to come.
Reviewing the chart (above), traffic congestion beyond 2024 will likely get worse if the SFMTA continues to build traffic barriers.
If current traffic congestion trends continue, San Franciscos congestion rates will rise to approximately 37% in 2027. That trend is projected to cause 45 to 47 vehicle deaths per year.
“In 2024, the average driving speed in San Francisco was 14 mph, 0.3 mph slower than in 2023, and the second-slowest mark of any major U.S. city. Only New York City (12 mph) was faster than San Francisco, according to traffic data recently published by the Dutch-based location technology firm TomTom.
There has been a rapid increase in deaths from 2022 to 2024. In 2024, 42 people died in traffic accidents — the most deaths ever recorded. An additional 12 people have already died in 2025. With a declining population of only 808,000 people, why are more San Francisco residents being killed in traffic accidents?
One possible answer is that the SFMTAs traffic slowing methods are a failure. Its project safety planning staff is “guessing” — not really knowing — how to make San Francisco streets safer.
San Francisco transportation officials are suspending a popular, long-running program that allows residents to request street safety improvements in their neighborhoods. The SFMTA said it would be “temporarily pausing” its Residential Traffic Calming Program, citing “rising construction costs, record demand, and a challenging fiscal landscape.”
The move comes as the agency faces an anticipated $322 million budget deficit next year when federal and state one-time relief funds run out. Did the SFMTA have a real plan for traffic safety?
Critics say the SFMTA planners dont know what they are doing and are attempting to apply a traffic-slowing methodology that only works in suburban, less congested cities.
San Francisco is an extremely dense city with high levels of traffic congestion, hills, bicycles, pedestrians and alternative wheeled vehicles.
If the SFMTA stops building road barriers immediately and reduces public safety barriers, there will likely be less congestion in San Francisco. The ill-advised plans to slow traffic will only cause more traffic deaths.
George Wooding, Neighborhood Activist Emeritus
July 2025